

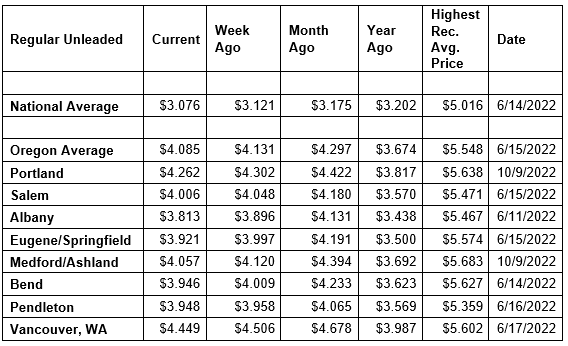
Crude oil prices below $60 per barrel and lackluster demand for gas in the U.S. are helping push pump prices lower. With the seasonal transition from summer- to winter-blend fuel, drivers are likely to see gas prices continue to decline, barring any disruptions in supplies. For the week, the national average for regular declines five cents to $3.08 a gallon. The Oregon average also falls five cents to $4.09 a gallon.
“Gas prices are falling like the autumn leaves. Relatively low demand and crude oil prices below $60 per barrel should make for even cheaper prices ahead,” says Marie Dodds, public affairs director for AAA Oregon/Idaho.
Pump prices on the West Coast were only mildly impacted by a huge fire at the El Segundo Chevron refinery in Southern California on Oct. 2. There were concerns that gas prices in the region would spike, but the average price of gas in California only increased a couple of cents, while the Oregon and Washington averages have declined. This facility is one of the largest in California, producing about 40% of Southern California’s jet fuel as well as about 20% of its fuel for cars.
The Oregon average for regular gas began 2025 at $3.45 a gallon and is currently at $4.09. The highest price of the year so far is $4.297 on September 13 and 14. The lowest price of the year so far is just under $3.45 a gallon on January 2.
The national average began 2025 at $3.06 a gallon and is currently at $3.08. The highest price of the year so far is $3.268 on April 4. The lowest price of the year so far is $3.06 on January 5.
This week 23 Oregon counties have averages at or above $4, compared to 26 a week ago:
Clackamas $4.23
Clatsop $4.09
Columbia $4.24
Coos $4.10
Crook $4.05
Curry $4.19
Douglas $4.00
Grant $4.02
Harney $4.33
Hood River $4.04
Jackson $4.06
Jefferson $4.
Josephine $4.12
Klamath $4.01
Lake $4.22
Morrow $4.01
Multnomah $4.31
Sherman $4.07
Tillamook $4.19
Wallowa $4.22
Wasco $4.13
Washington $4.27
Yamhill $4.12
Demand for gasoline in the U.S. increased from 8.52 million b/d to 8.92 million for the week ending October 3. This compares to 9.65 million b/d a year ago. Total domestic gasoline supply decreased from 220.7 million barrels to 219.1 million. Gasoline production increased last week, averaging 9.8 million barrels per day compared to 9.3 million barrels per day the previous week.
Gas prices usually drop in the fall, due to the switch from summer-blend to winter-blend fuel, which costs less to produce. The switch starts in September. Many areas, including Oregon, can sell winter-blend fuel starting September 15. However, Northern and Southern California require summer-blend fuel through October 31. Prices usually decline to their lowest levels of the year in late fall and early winter before increasing again in the late winter and early spring.
Gas prices typically rise starting in mid-to-late winter and early spring as refineries undergo maintenance ahead of the switch to summer-blend fuel, which is more expensive to produce and less likely to evaporate in warmer temperatures. The switch occurs first in California, which is why pump prices on the West Coast often rise before other parts of the country. The East Coast is the last major market to switch to summer-blend fuel. Most areas have a May 1 compliance date for refiners and terminals, while most gas stations have a June 1 deadline to switch to selling summer-blend until June 1. Switch-over dates are earlier in California with some areas in the state requiring summer-blend fuel by April 1. Some refineries will begin maintenance and the switchover in February.
The U.S. price of crude oil (West Texas Intermediate) plunged below $60 per barrel last Friday, closing at a five-month low of $58.90. It’s the first time WTI fell below $60 since May 7, 2025. Easing tensions in the Middle East between Israel and Hamas contributed to the decline, as well as escalating trade tensions between the U.S. and China.
WTI has been mostly in the low-$60s to mid-$70s since September 2024. Crude prices spiked to the mid-$70s in mid-June in response to the strikes between Israel and Iran, and then the U.S. strike on Iran’s nuclear facilities, but then prices fell back into the $60s on the belief that the conflict would not have a major impact on global oil supplies. Crude prices fell in early April as markets reacted to President Trumps tariffs and the impact on U.S. and global markets. Additional downward pressure on crude prices came after the decision by OPEC+ to increase production. The lowest closing price since September was $57.13 on May 5, which was the lowest closing price since February 2021. The recent high price for crude was $80.04 per barrel on January 15, which was the highest price since last August 2024.
Crude oil is trading around $58 today compared to $62 a week ago and $74 a year ago. In 2024, West Texas Intermediate ranged between $66 and $87 per barrel. In 2023, WTI ranged between $63 and $95 per barrel. WTI reached recent highs of $123.70 on March 8, 2022, shortly after the Russian invasion of Ukraine, and $122.11 per barrel on June 8, 2022. The all-time high for WTI crude oil is $147.27 in July 2008.
Crude prices are impacted by economic news as well as geopolitical events around the world including the current economic uncertainty, unrest in the Middle East, the war between Israel and Hamas, and the war between Russia and Ukraine. Russia is a top global oil producer, behind the U.S. and Saudi Arabia. Crude prices have been volatile after the attack on Israel by Hamas in October 2023. While Israel and the Palestinian territory are not oil producers, there were concerns that the conflict could spread in the Middle East, which could potentially impact crude production in other oil-producing nations in the region. In addition, production cuts by OPEC+ in previous years tightened global crude oil supplies, which continued to impact prices. But this year, the cartel has boosted production starting by 411,000 barrels per day in May, June, and July, 548,000 barrels per day in August, 547,000 barrels per day in September, and 137,000 barrels per day in October.
Crude oil is the main ingredient in gasoline and diesel, so pump prices are impacted by crude prices on the global markets. On average, about 51% of what we pay for in a gallon of gasoline is for the price of crude oil, 18% is refining, 16% distribution and marketing, and 16% are taxes, according to the U.S. Energy Information Administration.
Meanwhile, crude oil production in the U.S. remains near record highs. The U.S. Energy Information Administration (EIA) reports that crude production in his country rose from 13.50 million barrels per day to 13.62 for the week ending October 3. The record high is 13.631 million barrels per day for the week of December 6. Production has been at 13.5 million barrels per day many times since October 2024. The U.S. has been the top producer of crude oil in the world since 2018 and has been increasing its oil production since about 2009.
Quick stats
Oregon is one of 44 states with lower prices now than a week ago. Ohio (-20 cents) has the largest week-over-week decline in the nation. Maryland (+6 cents) has the biggest week-over-week increase in the nation.
California ($4.66) is the state with the most expensive gas in the nation for the fourth week in a row. Washington took over the top spot for a week in September when the Olympic Pipeline was out of operation. This week, Hawaii ($4.48) is second, Washington ($4.47) is third, and Oregon ($4.09) is fourth. These are the four states with averages at or above $4 a gallon. This week 16 states and the District of Columbia have averages in the $3-range. There are 30 states with an average in the $2 range this week.
The cheapest gas in the nation is in Oklahoma ($2.57) and Mississippi ($2.65) and. No state has had an average below $2 a gallon since January 7, 2021, when Mississippi and Texas were below that threshold. At the time, the COVID-19 pandemic drove significant declines in crude oil and gasoline demand in the U.S. and around the world.
The difference between the most expensive and least expensive states is $2.09 this week, compared to $2.07 a week ago.
Oregon is one of 46 states and the District of Columbia with lower prices now than a month ago. The national average is five cents less and the Oregon average is 21 cents less than a month ago. This is the sixth-largest month-over-month decline for a state in the nation. Indiana (-26 cents) has the largest month-over-month drop in the nation. Utah (+8 cents) has the largest month-over-month increase.
Oregon is one of seven states with higher prices now than a year ago. The national average is 13 cents less, while the Oregon average is 41 cents more. Oregon has the largest year-over-year increase in the nation. Washington (+40 cents) has the second-largest increase. Ohio (-41 cents) has the largest yearly drop.