
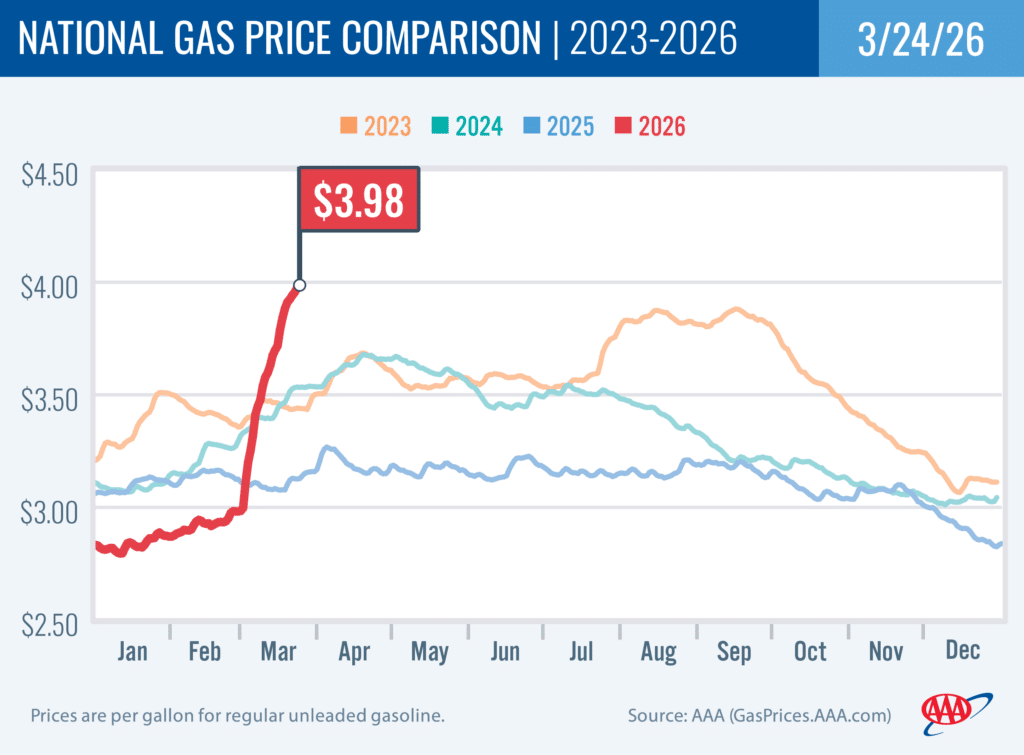
Gas prices continue to soar due to the conflict in Iran, the ongoing disruptions in the Strait of Hormuz, and damage to energy infrastructure in the Middle East, along with the usual seasonal factors. Both the national and Oregon averages for regular gas have jumped about $1 per gallon since the conflict began on Feb. 28. For the week, the national average for regular climbs 19 cents to $3.98 a gallon. The Oregon average jumps 33 cents to $4.87 a gallon.

The National average was $2.98 and Oregon average was $3.92 on Feb. 28. The national average is at its highest price since August 2022, and the Oregon average is at its highest price since November 2022.
The national average will likely top $4 per gallon this week for the first time since August 2022. The Oregon average may reach $5 per gallon for the first time since October 2022.
AAA offers tips on how to save on fuel purchases and increase fuel efficiency:
Shop around for the least expensive gas near you. Download the AAA Mobile app which lets you find the prices for all grades of fuel at gas stations that are close to your location. Pricing can vary widely from station to station – even gas stations that are across the street from each other can have differing pricing. The AAA Mobile App is free and available at the App Store and Google Play.
Take steps to conserve fuel. Even small things can add up to savings at the pumps. Here are some fuel-saving tips from AAA.
Consider using a credit card to pay for your fuel purchases so that you can get a cash rebate. Use a card that offers cash back on fuel purchases, or even better, use a card that gives you a higher percentage for gas purchases. The AAA Travel Advantage Visa card lets you earn 5% cash back on gas and electric vehicle charging stations. Find out more at https://oregon.aaa.com/financial/more-products/aaa-visa-credit-card.html
Some loyalty programs offer discounts on gas. Stores such as Safeway, Albertson’s and Fred Meyer offer fuel rewards programs that let customers earn discounts on gasoline by earning points from shopping.
AAA has a program called Shell Fuel Rewards®. Members who register by April 30 will get 35¢/gallon off their first fill at participating Shell stations, and all AAA Fuel Rewards members will save 10¢/gallon during that time period, which is an additional 5¢/gallon compared to the standard Fuel Rewards discount.
“The conflict with Iran comes at the time of year we normally see pump prices increase due to the usual factors this time of year, including refinery maintenance, the switch to more expensive summer-blend fuel, and the increase in demand for gas that we typically see in the spring. Concerns about global oil supplies are keeping crude oil prices elevated, which drives up the price of gasoline, diesel, and jet fuel,” says Marie Dodds, public Affairs director for AAA Oregon/Idaho.
Crude oil prices remain significantly higher than before the conflict began, but have eased to start this week as markets assess developments in the Iran war. West Texas Intermediate, the U.S. benchmark for crude, spiked from about $67 per barrel the day before the conflict to near $100.
In general, every $1 increase in the price of crude oil leads to a 2.4- to 2.5-cent increase in the price of gasoline.
About 20% of the world’s oil and refined products flow through the Strait of Hormuz, which is the narrow passageway of the Persian Gulf and is bordered by Iran. Tankers traveling through the Strait of Hormuz carry oil from major producers in the Middle East including Saudi Arabia, Kuwait, Bahrain, UAE, Qatar, Iraq and Iran. Any disruption in the straight can impact global oil supplies. While the U.S. does not rely on Iranian oil, nations such as China, India and Pakistan do.
The Oregon average for regular gas began 2026 at $3.42 a gallon. The highest price of the year so far is today’s price of $4.87. The lowest price of the year so far is $3.33 on January 20.
The national average began 2026 at $2.83 a gallon. The highest price of the year so far is today’s price of $3.98. The lowest price of the year so far is $2.795 on January 11.
Demand for gasoline in the U.S. gasoline decreased from 9.24 million b/d to 8.73 million for the week ending March 13. This compares to 8.82 million b/d a year ago. Total domestic gasoline supply decreased from 249.5 million barrels to 244.0 million. Gasoline production decreased last week, averaging 9.4 million barrels per day, compared to 9.9 million barrels per day the previous week.
Gas prices typically rise starting in mid-to-late winter and early spring as refineries undergo maintenance ahead of the switch to summer-blend fuel, which is more expensive to produce and less likely to evaporate in warmer temperatures. The switch occurs first in California, which is why pump prices on the West Coast often rise before other parts of the country. The East Coast is the last major market to switch to summer-blend fuel. Most areas have a May 1 compliance date for refiners and terminals, while most gas stations have a June 1 deadline to switch to selling summer-blend. Switch-over dates are earlier in California with some areas in the state requiring summer-blend fuel by April 1. Some refineries will begin maintenance and the switchover in February.
Gas prices usually drop in the fall, due to the switch from summer-blend to winter-blend fuel, which costs less to produce. The switch starts in September. Many areas, including Oregon, can sell winter-blend fuel starting September 15. However, Northern and Southern California require summer-blend fuel through October 31. Prices usually decline to their lowest levels of the year in late fall and early winter before increasing again in the late winter and early spring.
The U.S. price of crude oil (West Texas Intermediate) remains near four-year highs around $92 per barrel, due to supply disruptions caused by the conflict with Iran. WTI had mostly been in the upper $50s to mid-$70s since September 2024, and had mostly been in the $55 to $65 range for the past few months. Oil prices rose last month, in part driven by escalating tensions between the U.S. and Iran. Then crude oil prices shot up after the strikes on Iran by the U.S. and Israel. Any conflict with Iran can send oil prices higher, as Iran is a major oil producer and about a fifth of the oil consumed globally travels through the Strait of Hormuz between Iran and Oman.
WTI is trading around $93 today, compared to $96 a week ago and $69 a year ago. In 2025, West Texas Intermediate ranged between $80.04 (January 15) and $57.46 (October 16) per barrel. In 2024, WTI ranged between $66 and $87 per barrel. In 2023, WTI ranged between $63 and $95 per barrel. WTI reached recent highs of $123.70 on March 8, 2022, shortly after the Russian invasion of Ukraine, and $122.11 per barrel on June 8, 2022. The all-time high for WTI crude oil is $147.27 in July 2008.
Crude prices are determined in international markets, based on global supply and demand, and are impacted by economic news as well as geopolitical events around the world including the current conflict with Iran, economic uncertainty, the situation in Venezuela, tensions over Greenland, sanctions on Iran’s oil, unrest in the Middle East, the conflict between Israel and Hamas, and the war between Russia and Ukraine. Russia is a top global oil producer, behind the U.S. and Saudi Arabia.
In addition, moves by OPEC+ impact crude oil prices. Production cuts by the cartel in previous years tightened global crude oil supplies, which continued to impact prices. But in 2025, the cartel boosted production which put downward pressure on crude oil prices. For the first quarter of 2026, OPEC+ said it would not have production hikes in the first quarter of this year due to lower demand. However, at its meeting on March 1, OPEC+ said it would boost oil production by 206,000 barrels a day in April. This may help mitigate the impact of the Iran conflict on oil prices.
Crude oil is the main ingredient in gasoline and diesel, so pump prices are impacted by crude prices on the global markets. On average, about 51% of what we pay for in a gallon of gasoline is for the price of crude oil, 20% is refining, 11% distribution and marketing, and 18% are taxes, according to the U.S. Energy Information Administration.
Meanwhile, crude oil production in the U.S. remains at or near record highs. The U.S. Energy Information Administration (EIA) reports that crude production in his country is at 13.67 million barrels per day for the week ending March 13. Production has been at 13.5 million barrels per day many times since October 2024. The U.S. has been the top producer of crude oil in the world since 2018 and has been increasing its oil production since about 2009.
Quick stats
Oregon is one of 49 states and the District of Columbia with higher prices this week. Illinois (+42 cents) has the largest week-over-week jump in the country. Georgia (+1/2 cent) has the smallest. Iowa (-2 cents) is the only state with a week-over-week decline.
California ($5.82) has the most expensive gas in the nation for the seventh week in a row. Washington ($5.29) is second, and Hawaii ($5.28) is third. These are the states with averages at or above $5 per gallon. This week there are eight states and the District of Columbia with averages at or above $4 a gallon. This week 39 states have averages in the $3-range. No state has an average in the $2 range this week.
The cheapest gas in the nation is in Oklahoma ($3.26) and Kansas ($3.28). No state has had an average below $2 a gallon since January 7, 2021, when Mississippi and Texas were below that threshold. At the time, the COVID-19 pandemic drove significant declines in crude oil and gasoline demand in the U.S. and around the world.
The difference between the most expensive and least expensive states is $2.56 this week, compared to $2.33 a week ago.
All 50 states and the District of Columbia have higher prices now than a month ago. The national average is $1.03 more and the Oregon average is 96 cents more than a month ago. Arizona (+$1.36) has the largest month-over-month jump in the nation. Minnesota (+74 cents) has the smallest.
All 50 states and the District of Columbia have higher prices now than a year ago. The national average is 85 cents more, while the Oregon average is $1.13 more. Arizona (+$1.27) has the largest year-over-year jump in the nation. Iowa (+29 cents) has the smallest.
West Coast
The West Coast region continues to have the most expensive pump prices in the nation with all seven states in the top 10. It’s typical for the West Coast to have six or seven states in the top 10 as this region tends to consistently have fairly tight supplies, consuming about as much gasoline as is produced. In addition, this region is located relatively far from parts of the country where oil drilling, production and refining occurs, so transportation costs are higher. And environmental programs in this region add to the cost of production, storage and distribution.
| Rank | Region | Price on 3/24/2026 |
| 1 | California | $5.82 |
| 2 | Washington | $5.29 |
| 3 | Hawaii | $5.28 |
| 4 | Oregon | $4.87 |
| 5 | Nevada | $4.81 |
| 6 | Arizona | $4.61 |
| 7 | Alaska | $4.54 |
| 8 | Illinois | $4.21 |
| 9 | Idaho | $4.17 |
| 10 | District of Columbia | $4.09 |
As mentioned above, California has the most expensive gas in the country for the seventh consecutive week. Washington, Hawaii, Oregon, Nevada, Arizona, and Alaska and round out the top seven. Oregon rises to fourth most expensive after two weeks at fifth.
All seven states in the West Coast region have week-over-week increases: Oregon (+33 cents), Alaska (+30 cents), Hawaii (+30 cents), Washington (+29 cents), California (+28 cents), Arizona (+26 cents), and Nevada (+21 cents).
The refinery utilization rate on the West Coast decreased from 83.8% to 79.8% for the week ending March 13. This rate has ranged between about 72% to 93% in the last year. The latest national refinery utilization rate rose from 90.8% to 91.4%.
The refinery utilization rate measures how much crude oil refineries are processing as a percentage of their maximum capacity. A low or declining rate can put upward pressure on pump prices, while a high or rising rate can put downward pressure on pump prices.
According to EIA’s latest weekly report, total gas stocks in the region dipped from 28.32 million bbl. to 27.37 million bbl. for the week ending March 13. An increase in gasoline stocks can put downward pressure on pump prices, while a decrease in gasoline stocks can put upward pressure on pump prices.
Oil market dynamics
Crude oil prices fell yesterday (Monday) largely in response to President Trump’s post that the U.S. and Iran had engaged in talks to end the conflict. Crude prices are up today on concerns that the conflict will not de-escalate soon. It’s still not clear when the Strait of Hormuz may reopen. The conflict has led to the worst disruption in global oil supplies in decades due to the stalling of ship traffic through the Strait of Hormuz and the damage to energy infrastructure in the region. Expect oil prices to remain volatile as anytime a major oil producer, such as Iran, is involved in a geo-political event, and there’s a disruption in oil tanker traffic, crude prices go up due to market concerns about global oil supplies.
Meanwhile, the EIA reports that crude oil inventories increased by 6.2 million barrels from the previous week. At 449.3 million barrels, U.S. crude oil inventories are about 1% below the five year average for this time of year.
At the close of Friday’s formal trading session, WTI rose $2.18 to close at $98.32. At the close of Monday’s formal trading session, WTI fell $10.19 to close at $88.13. Today crude is trading around $93, compared to $96 a week ago. Crude prices are about $24 more than a year ago. ($69.11 on March 24, 2025)
Drivers can find current gas prices along their route with the free AAA Mobile app for iPhone, iPad and Android. The app can also be used to map a route, find discounts, book a hotel and access AAA roadside assistance. Learn more at AAA.com/mobile.
Diesel
Diesel prices are increasing faster than gasoline due to low global supplies and high demand for heating oil.
For the week, the national average rises 30 cents to $5.35 a gallon. This is the highest price for the national average for diesel since November 2022. The record high is $5.816 set on June 19, 2022.
The Oregon average jumps 45 cents to $5.93. This is the highest price for the Oregon average for diesel since August 2022. The record high is $6.47 set on July 3, 2022.
A year ago the national average for diesel was $3.58 and the Oregon average was $3.86.
Find current fuel prices at GasPrices.AAA.com.