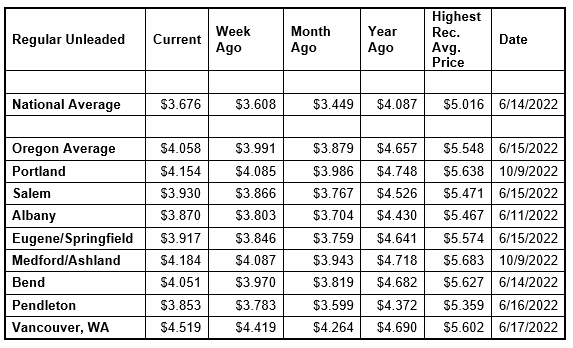
Gas prices are climbing in almost every state again this week. The major driver is the higher cost of crude oil which has been hovering in the low $80s per barrel. Pump prices have been steadily edging up since late March. For the week, the national average for regular unleaded gains seven cents to $3.68 a gallon. The Oregon average adds seven cents to $4.06. This is the first week the Oregon average has been above $4 since mid-December.
“Crude oil prices above $80 per barrel put upward pressure on pump prices. As long as crude remains near the current level, drivers will likely see incremental price increases at the pumps for now,” says Marie Dodds, public affairs director for AAA Oregon/Idaho.
Oil prices rose above $80 per barrel after the April 2 announcement from the Organization of the Petroleum Exporting Countries and other major oil producers, including Russia, known collectively as OPEC+, that the cartel would cut oil production by just over 1 million b/d through the end of 2023. The move comes at a time when pump prices were already rising due to the switch to summer-blend fuel and seasonal higher demand.
Crude oil continues to trade around $81 today compared to $82 a week ago and $108 a year ago. In March, West Texas Intermediate ranged between about $64 and $81 per barrel. In February, WTI ranged between about $73 and $80 per barrel. In January, WTI ranged between about $73 and $82 bbl. Crude reached recent highs of $123.70 on March 8, 2022, shortly after the Russian invasion of Ukraine, and $122.11 per barrel on June 8, 2022. The all-time high for WTI crude oil is $147.27 in July 2008.
Crude oil is the main ingredient in gasoline and diesel, so pump prices are impacted by crude prices on the global markets. On average, about 56% of what we pay for in a gallon of gasoline is for the price of crude oil, 20% is refining, 11% distribution and marketing, and 14% are taxes, according to the U.S. Energy Information Administration.
Another factor putting upward pressure on pump prices this time of year is the seasonal switch to summer-blend fuel. California has an April 1 deadline to switch to summer-blend fuel, while the federally mandated deadline is May 1. The West Coast region often sees prices climb earlier than other parts of the country because of that earlier California deadline. More info on summer- and winter-blend gasoline can be found at the EPA website.
Demand for gasoline in the U.S. demand decreased from 9.3 to 8.94 million b/d for the week ending April 7.
This compares to 8.74 million b/d a year ago. Meanwhile, total domestic gasoline stocks dropped slightly by 400,000 bbl to 222.2 million bbl. Lower demand would typically push pump prices down; instead, elevated oil prices have pushed them higher. If oil prices continue to rise, pump prices will follow suit.
Quick stats
Oregon is one of 48 states and the District of Columbia with higher prices now than a week ago. Minnesota (+18 cents) has the largest weekly jump. Ohio (-4 cents) and Hawaii (-1 cent) are the only two states with week-over-week declines.
California ($4.92) has the most expensive gas in the nation for the seventh week in a row. Hawaii ($4.79) is second, Arizona ($4.56) is third, Washington ($4.52) is fourth, and Nevada ($4.28) is fifth, Illinois ($4.07) is sixth, and Oregon ($4.06) is seventh. These are the seven states with averages at or above $4 a gallon. This week 43 states and the District of Columbia have averages in the $3-range. No states have averages in the $2 range this week, same as a week ago.
The cheapest gas in the nation is in Mississippi ($3.17) and Arkansas ($3.24). For the 118th week in a row, no state has an average below $2 a gallon.
The difference between the most expensive and least expensive states is $1.75 this week, same as a week ago.
Oregon is one of 46 states and the District of Columbia with higher prices now than a month ago. The national average is 23 cents more and the Oregon average is 18 cents more than a month ago. Arizona (+60 cents) has the largest monthly jump. Colorado (-21 cents) has the largest monthly decline.
All 50 states and the District of Columbia have lower prices now than a year ago. The national average is 41 cents less and the Oregon average is 60 cents less than a year ago. Nevada (-80 cents) has the largest yearly drop. Arizona (-1 cent) has the smallest. A year ago, pump prices were rising rapidly after the start of the Russian invasion of Ukraine.